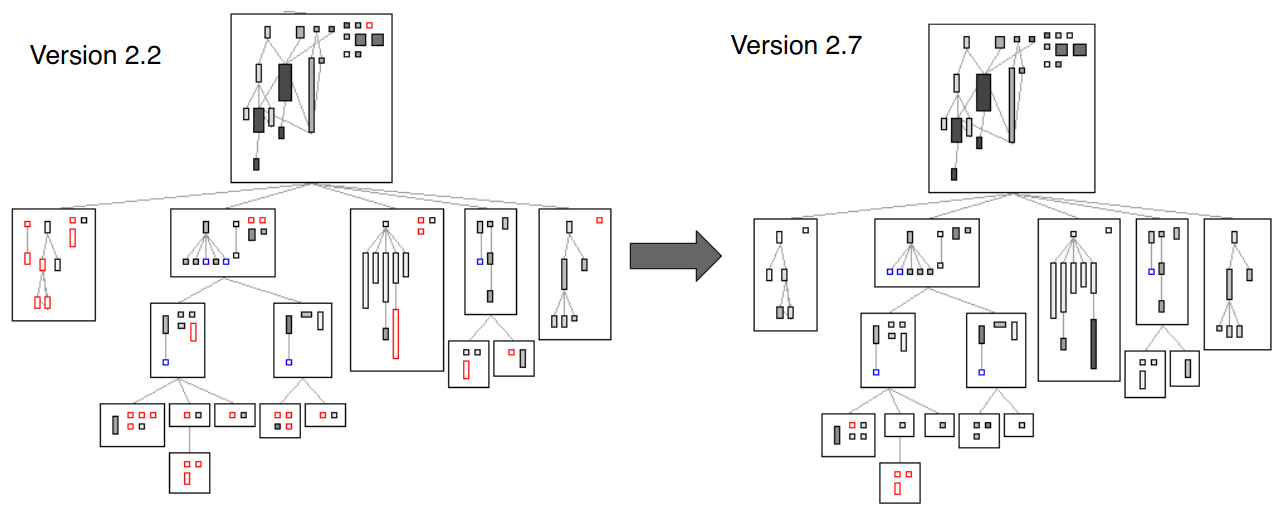
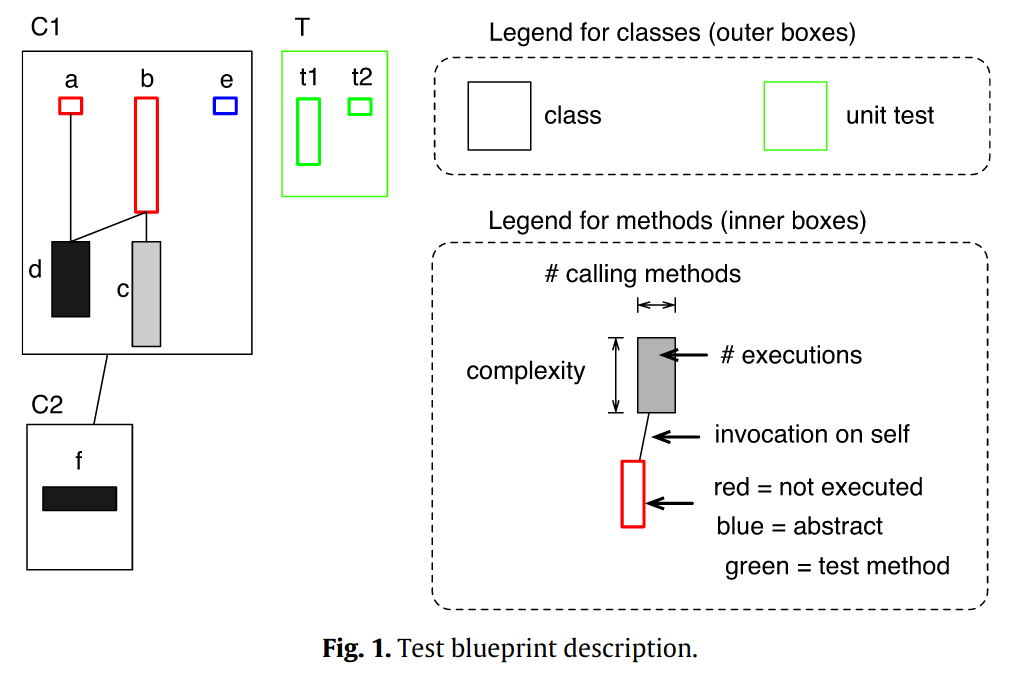
The goal of this project was to design a visualization that allowed developers to improve the test coverage of their software applications. In our case, we designed the visual mapping you see in the image above: each class is a rectangle that contains all its methods, represented by smaller rectangles. Methods then are drawn according to certain metrics, from which one of the most outstanding are red borders that indicate that the method was not tested at all. Width and fill color indicate how many times they were execute by the tests and their height how complex they are. Using this visual representation, developers can easily see untested parts of their software or which are weakly tested.
The following image shows an example of use of Hapao. In particular, it shows the evolution of the test coverage of the hierarchy of the class MOAbstractGraphLayout. This class was part of Mondrian, the visualization engine that Hapao used to render (at least on its first versions).

The tool that implements this visual representation is called Hapao and it was developed in the Pharo language and developing environment and later transferred to VisualWorks
You can find the original prototype here, a later version here and the latest version of the complete profiler tool here.
There are three main publications associated to this project:
-
Alexandre Bergel, Vanessa Peña Araya.
Increasing Test Coverage with Hapao, Science of Computer Programming, 79:86–100, 2014. Experimental Software and Toolkits (EST 4): A special issue of the Workshop on Academic Software Development Tools and Techniques (WASDeTT-3 2010)

-
Vanessa Peña Araya.
Test Blueprint: An Effective Visual Support for Test Coverage, Proceedings of the International Conference on Software Engineering (ICSE), 2011, ACM Press. Student Research Competition track, pages 1140-1142. (This paper participated in the ACM Student Research Competition at ICSE'11. It got 2nd place undergraduate category. 2nd place Grand final)

-
Alexandre Bergel, Vanessa Pena-Araya, Tobias Kuhn.
Controlled experiment to assess a test-coverage visualization: Lesson learnt, 2015.

