The insights obtained after analyzing the geographical propagation of tweets during my PhD motivated me to study more deeply what were the limitations of the most commonly used visualizations for geo-temporal data, which was the main topic on my first year of postdoc at the ILDA team.
On the one hand, we were interested to understand how the available geo-temporal visualizations allowed users to compare the correlation between two variables. For example, imagine we want to understand how the corelation between literacy rate and the working hours changed over time in the United States. The following image shows the 3 visualizations we evaluated artificially-created values for this example.

Our evaluation showed that the performance of the visualizations differ depending on the temporal granularity considered (all time steps, a subrange of steps, one step only) and also geographical one (all locations, locations in a subregion, one location only). More details of this study can be found in the publication associated with it:
- Vanessa Peña-Araya, Emmanuel Pietriga, Anastasia Bezerianos.
A Comparison of Visualizations for Identifying Correlation over Space and Time, IEEE Transactions on Visualization and Computer Graphics.


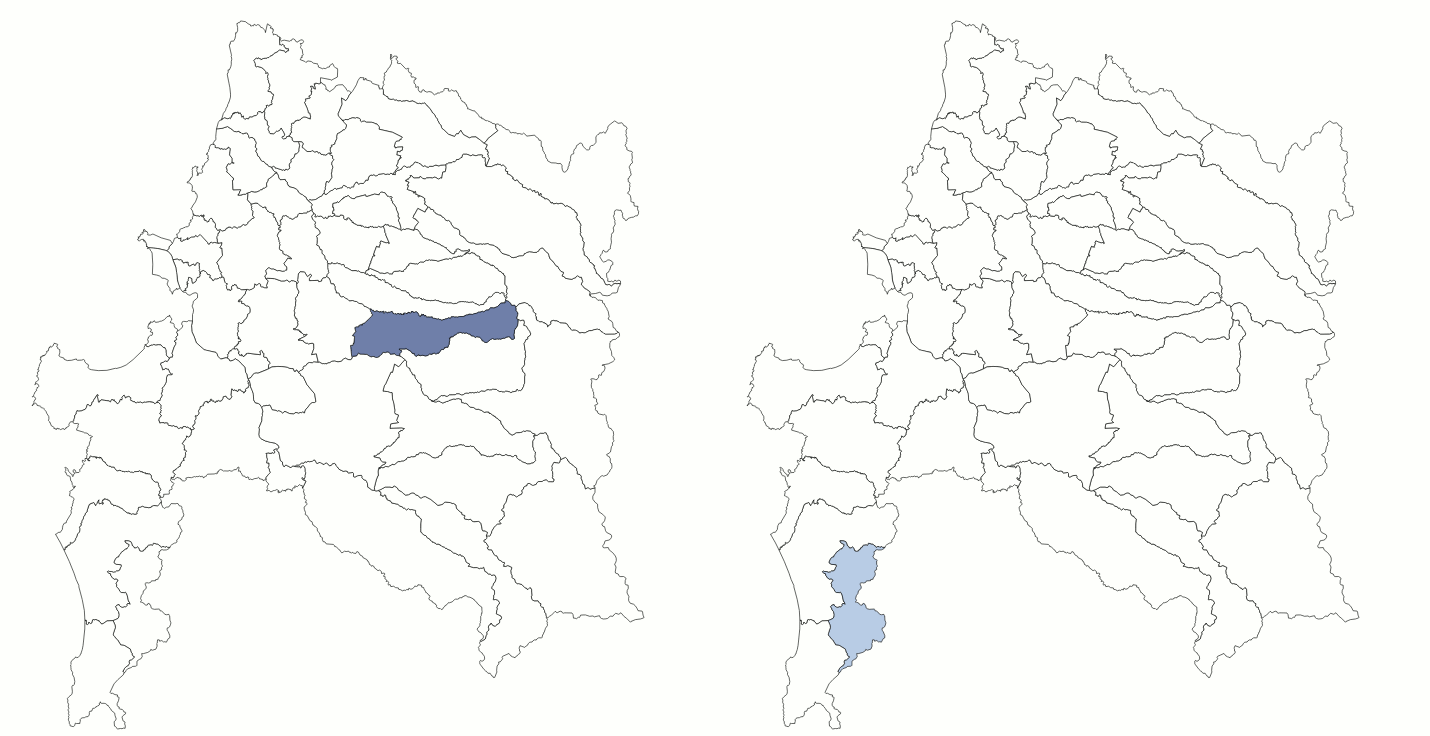
The second study was motivated while trying to visualize how tweets propagate over space and time after a news event happens. This phenomena also applies to the propagation of diseases and the propagation of informatic viruses. The following image whoes the three visualizations we evaluated:

We evaluated the visualizations for 5 tasks: scope, direction, arrival, hops and peak. Similar to the previous study, our results show that the performance of the visualizations depends on the task. For more details, please refer to the publication associated:
- Vanessa Peña-Araya, Anastasia Bezerianos, Emmanuel Pietriga.
A Comparison of Geographical Propagation Visualizations. In CHI ’20: Proceedings of the 2020 CHI Conference on Human Factors in Computing Systems, 223:1-223:14, ACM, 2020.
